
In the blog post The Surface Under the Water – A Guide to Bathymetric Data in Global Mapper, Blue Marble Geographics explores how bathymetry, a key component of hydrography, involves measuring water depth to map underwater terrain.
This data is typically used to generate 3D models of the seafloor, which can be visualized and analyzed in Global Mapper using the same tools applied to terrestrial elevation models.
Because lidar is less effective underwater, bathymetric data is primarily collected using sonar, specifically, acoustic pulses transmitted and received by echo sounders. Depending on the depth and scope of the survey, these sounders may use single or multibeam configurations, and in some cases, may be deployed autonomously.
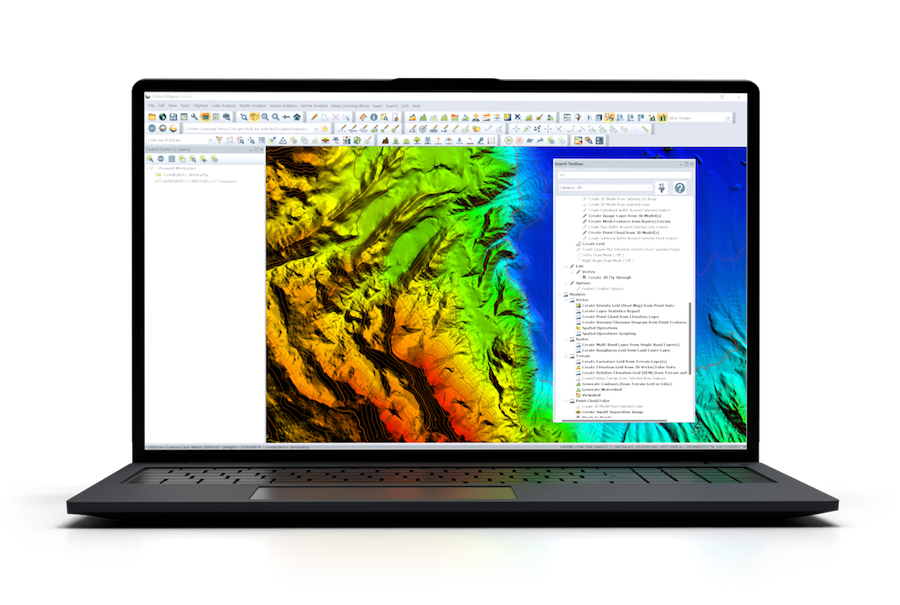
Once collected, bathymetric data forms a point cloud that can be gridded into a continuous 3D surface. While some organizations deliver this data pre-gridded, Global Mapper is also capable of processing raw acoustic returns. With the data in a terrain grid format, users can apply terrain analysis tools to explore features like ridges and depressions, generate contours, and filter data by depth values. Cross-sectional terrain views can also be created using the Path Profile tool, allowing for detailed examination of underwater features along linear paths or in parallel segments.
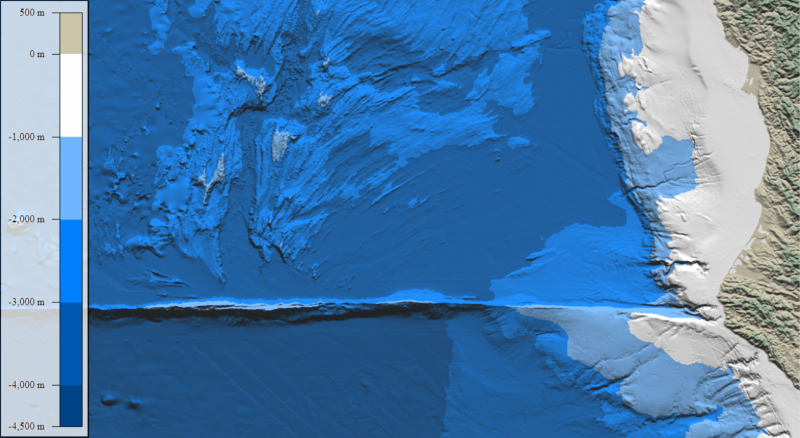
For visualization, users can blend 3D bathymetric data with overlaid raster charts using display settings that apply hill shading to the image. These tools enhance the interpretability of complex marine terrain. Editing tools in Global Mapper also allow users to simulate modifications, such as dredging, by altering terrain surfaces and calculating volume changes. The full article explores each of these capabilities in greater detail.