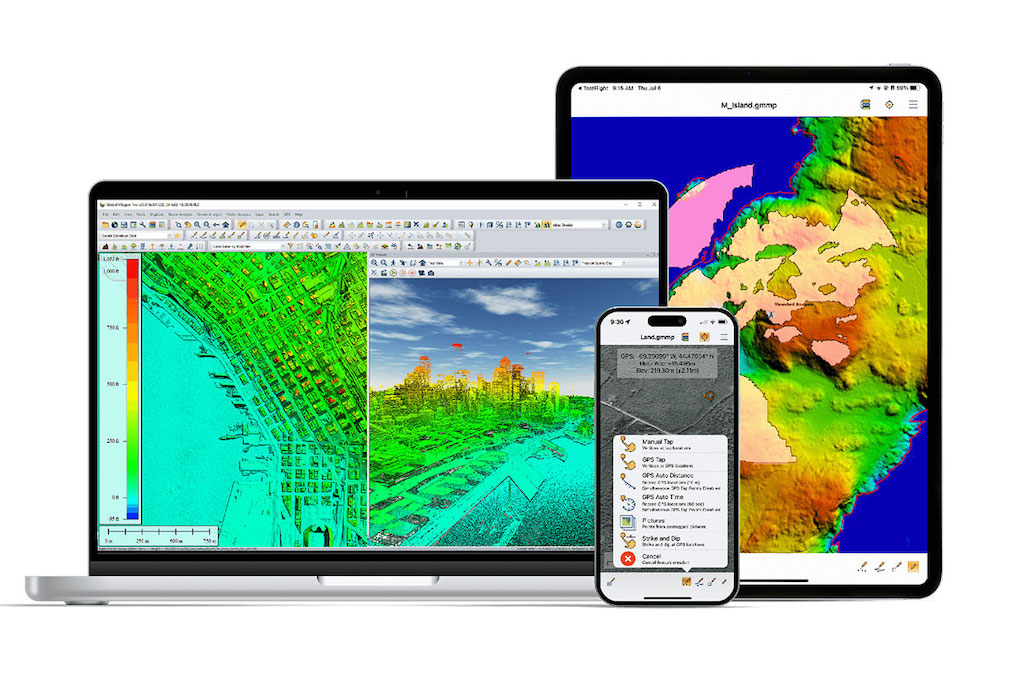

Blue Marble Geographics’ Global Mapper Pro played a key role in Bintang Subsea Indonesia’s planning and execution of a Red Sea survey mission, enhancing navigation, data integration, and analysis for precise bathymetric mapping.
Customer Profile: David Wibowo, Data Processing Coordinator at Bintang Subsea Indonesia, Jakarta. The company provides services in bathymetric surveying, positioning, subsea inspection, and metocean data collection, using advanced technology and methodologies.
Product Used: Global Mapper Pro
Project Challenge
Bintang Subsea needed to chart a survey path for the Autonomous Unmanned Surface Vehicle (AUSV) Triton based on known terrain data, ensuring efficient and safe navigation during subsea data collection.
Software-Based Solution
Using Global Mapper, the team integrated multiple maps and projections into a unified 3D workspace for both route planning and post-survey processing.
The Al Falah Survey
Bintang Subsea conducted a survey in the Red Sea to assist with seabed analysis for future underwater infrastructure. The AUSV Triton was deployed to collect bathymetric data, helping to identify suitable locations for platform placement related to oceanographic research. Global Mapper was used to plan the survey route by integrating geographic data such as nautical charts and bathymetric layers. These inputs were transformed, digitized, and georeferenced within Global Mapper to create a unified dataset that guided path planning.
David Wibowo, Data Processing Coordinator, commented, “The Global Mapper-enabled route-planning, combined with the incorporation of multibeam data, yielded a comprehensive survey strategy that maximized efficiency, accuracy, and safety.”
Once the route was finalized in Global Mapper, it was programmed into the AUSV Triton’s AIS (Automatic Identification System). This system, critical for maritime navigation, enabled real-time tracking and communication between vessels. The planned route from Global Mapper was translated into a sequence of waypoints and geospatial coordinates compatible with the AIS interface.
Executing the Mission
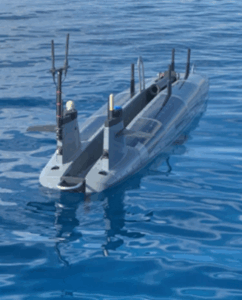
The AUSV Triton running the survey line.
Multibeam bathymetry, captured using sonar systems onboard Triton, produced high-resolution maps of the seafloor. These data provided insights into underwater formations such as ridges and depressions. The integration of multibeam data into the planning process helped refine navigation and route adjustments, minimizing the risk of obstacles and shallow areas. AIS programming also incorporated contingency plans to adapt to changing conditions or unexpected challenges during the mission.
Wibowo added, “Global Mapper [is] a versatile GIS software tool, renowned for its capabilities in geospatial data manipulation and analysis.”
Results
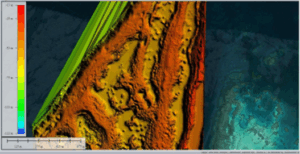
The resulting dataset was used to determine the optimal location for a future offshore platform housing oceanographic sensors. Global Mapper’s 3D Viewer supported quality assurance by allowing visualization of new and historical data in a shared 3D space. The Path Profile tool provided perpendicular terrain views to measure slope and support accurate seabed assessment.
The Al Falah Survey demonstrated the effective integration of GIS tools, multibeam sonar data, and AIS-based navigation. Global Mapper enabled precise planning and post-processing, while AIS implementation supported safe, real-time operations at sea.
Capabilities of Global Mapper with Bathymetric Data
Combining Multiple Data Sources
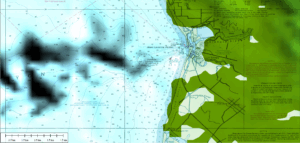
An older nautical map georeferenced on top of a DEM. Global Mapper’s image blend tools were used to remove the background color from the map, rendering only the data on top of the clearly visible DEM underneath. These display tools allow for enhanced map-making and easy data comparison.
Older bathymetric inputs, such as scanned charts or PDFs, can lack spatial referencing. Global Mapper’s georeferencing tool allows these to be accurately aligned with new digital data. Supporting nearly 400 formats, Global Mapper can incorporate legacy and modern sources into one platform. Additional bathymetric layers are also accessible through the Online Data tool’s Nautical Maps section.
3D Visualization of Seafloor Features
Using the Path Profile tool, cross-sections of bathymetric terrain can be created. The perpendicular profile tool enables side-by-side views for better analysis of changes across areas. These visualizations can be exported and used in modeling software, particularly where traditional terrain data are too complex.
Tracking Seafloor Changes Over Time
When bathymetric datasets from different time periods are available, the Compare Terrain Grid tool can measure elevation changes. For example, comparing pre- and post-hurricane data can reveal where sediment shifted. This type of change detection can also be performed using point cloud data, or between point cloud and grid layers, offering a fine-scale view of underwater landscape transformation.
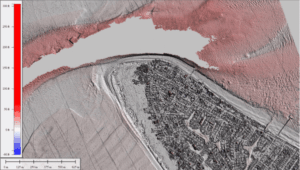
These red and blue colors represent the height difference in feet between the 2017 and 2022 datasets for this area. Red portions of the data indicate an increase in elevation during that time.
Global Mapper Pro proved essential in merging diverse geospatial data, planning precise survey routes, and processing multibeam results, demonstrating its value in subsea mapping and navigation workflows.