
Discover World-Leading Technologies for Ocean Science
Discover cutting-edge solutions from leading global suppliersEchoview Software, a leader in hydroacoustic data science, has released Echoview 16, the latest version of its premier software for visualizing and processing active acoustic data.

Used globally across marine, freshwater, and estuarine environments, Echoview transforms raw active acoustic data into results for applications like stock assessment, ecosystem monitoring, habitat mapping, and environmental management. The software is employed by scientists, research institutions, environmental agencies, and non-government organizations in over 70 countries and is designed for water column research, supporting a wide range of sonar and echosounder data formats.
Echoview 16 introduces several new features focused on enhancing the user experience with more precise workflows, richer visuals, and dynamic analysis tools. A key addition is support for data recorded by Humminbird fish finders, including the Apex, Solix, Helix, and 900/1100 series models. Compatibility is also expanded for previously supported formats, such as enabling depth-dependent sound speed corrections for Nortek echograms using Conductivity, Temperature, Depth (CTD) casts and utilizing pulse duration read from Lowrance *.sl3 files.
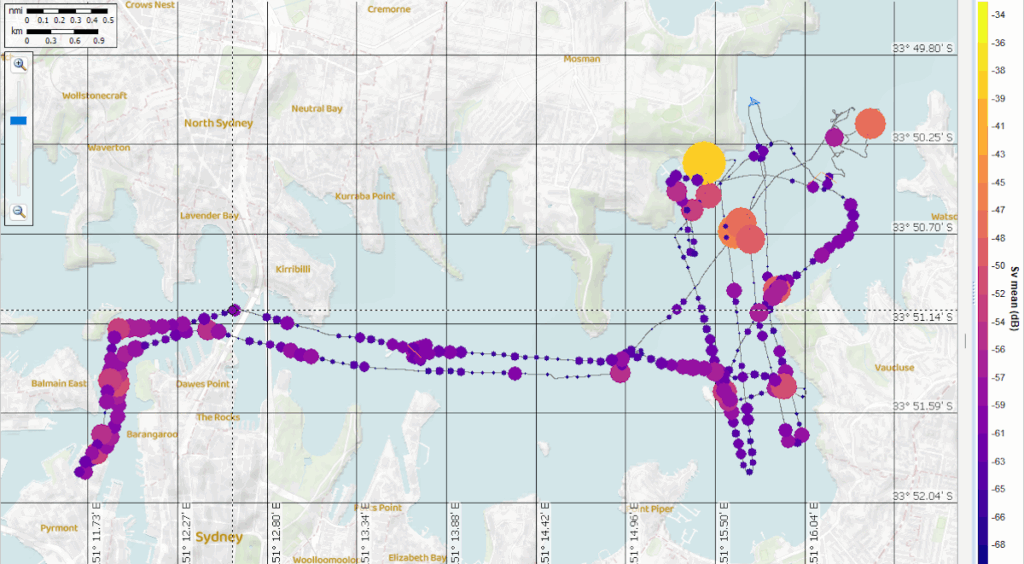
The new version features bubble charts or proportional symbol maps, which offer an intuitive update to traditional alongtrack displays. These displays allow users to map key metrics, such as fish density or NASC, as bubbles on a map. This helps users quickly visualize spatial trends, identify outliers for further investigation, and generate presentation-ready visuals.
Another significant update is the introduction of wideband-specific echointegration analysis variables for Kongsberg EK80 data. This feature allows for a direct comparison of wideband abundance and biomass estimates with traditional narrowband echointegration methods.
In addition, Echoview 16 can now convert single-beam Sv, TS, angular position, GPS, and heading data into *.nc files that conform to the ICES SONAR-netCDF4 standard (version 2, type 5 equations). This simplifies the process of archiving data in a standard format, sharing results with collaborators, or integrating them with third-party tools.
New time sliders in alongtrack displays and cruise track windows enable users to focus on specific time periods or transects, facilitating context assessment, especially during long surveys or when isolating exact sections. The software also offers support for Web Map Tile Service (WMTS) maps, which provides faster, higher-quality, and more detailed background maps from custom or online servers.
Finally, a suite of new Interval Analysis operators is included, making it simpler to calculate, extract, and visualize individual metrics over time. These operators analyze data in intervals (distance, time, or ping number), producing a time series of values that can be compared and graphed with cruise tracks and echograms.
Briony Hutton, Echoview Software’s Chief Scientist, commented, “Echoview 16 combines the expertise of our programmers, quality assurance specialists, technical writers, and scientists to deliver sophisticated software. We’ve focused on making it easier to work with your data by providing clearer visuals, smoother workflows, and more capable analysis tools, so that our users can get more out of every dataset and project.”